
WebRTC bitrate is not what you think
![]()
Most WebRTC discussions about bitrate are wrong. Not because people don’t know the APIs, but because they don’t control the experiment.
So instead of asking:
“what bitrate should I use?”
I built something slightly different:
a reproducible WebRTC benchmark to measure how codecs behave under controlled conditions
This is what came out of it.
(Post second part at WebRTC bitrate is not what you think, Part II (Mediasoup edition).)
The key idea: stop tweaking, start measuring
Typical WebRTC demos let you:
- pick a bitrate
- start a call
- watch a graph
But they don’t let you answer:
- how codecs compare under identical conditions
- how bitrate scales with resolution
- what happens at extreme low resolutions
- how packetization differs between codecs
So the goal here was not another demo.
It was:
a minimal, controlled measurement pipeline
You can get the source code at Content-PeerConnection-bandwidth: A WebRTC benchmarking sandbox for codec bitrate analysis.
Architecture: eliminate variables until only the codec remains
Loopback PeerConnection
Instead of testing over a network:
-
pc1sends -
pc2receives - both live in the same page
👉 No network noise. No congestion variability. Just encoder + RTP behavior.
Synthetic video (this is more important than it looks)
Real cameras are chaotic:
- lighting changes
- motion varies
- compression becomes content-dependent
So the system includes a synthetic video generator:
- deterministic color patterns
- controlled motion
- stable entropy
canvas.captureStream(frameRate);
👉 This is what makes results reproducible, not just observable.
Hard enforcement of codec selection
This is one of the most critical (and often ignored) parts.
The system:
- queries
RTCRtpSender.getCapabilities('video') - filters out non-codecs (
rtx,red, etc.) -
applies:
transceiver.setCodecPreferences([selectedCodec]); - verifies the negotiated codec after SDP exchange
- fails if multiple codecs are active
👉 If you don’t do this, your benchmark is invalid.
Measuring reality, not configuration
Every second, the system samples:
sender.getStats();
And computes:
Bitrate
$$ bitrate = 8 \cdot \frac{\Delta bytesSent}{\Delta t} \cdot 1000 $$
Where:
-
bytesSentis the total bytes sent by the RTP stream -
tis the timestamp of the stats report
Header bitrate
$$ header\ bitrate = 8 \cdot \frac{\Delta headerBytesSent}{\Delta t} \cdot 1000 $$
Packets per second
$$ pps = \Delta packetsSent $$
Then accumulates:
- average bitrate
- peak bitrate
- average pps
- peak pps
And exports:
codec,width,height,framerate,max_bps,avg_bps,max_packets,avg_packets
👉 This is not a demo anymore. This is a dataset.
The pipeline (this is where it becomes interesting)
- Run controlled experiment in browser
- Copy CSV row
- Append to dataset
- Generate chart with Node script
The plotting script:
- groups by codec
- sorts resolutions by pixel count
- generates:
- solid line → average bitrate
- dashed line → peak bitrate
👉 This separation (measurement vs visualization) is what makes the system clean.
The results (this is where things get real)
Here’s the generated chart:
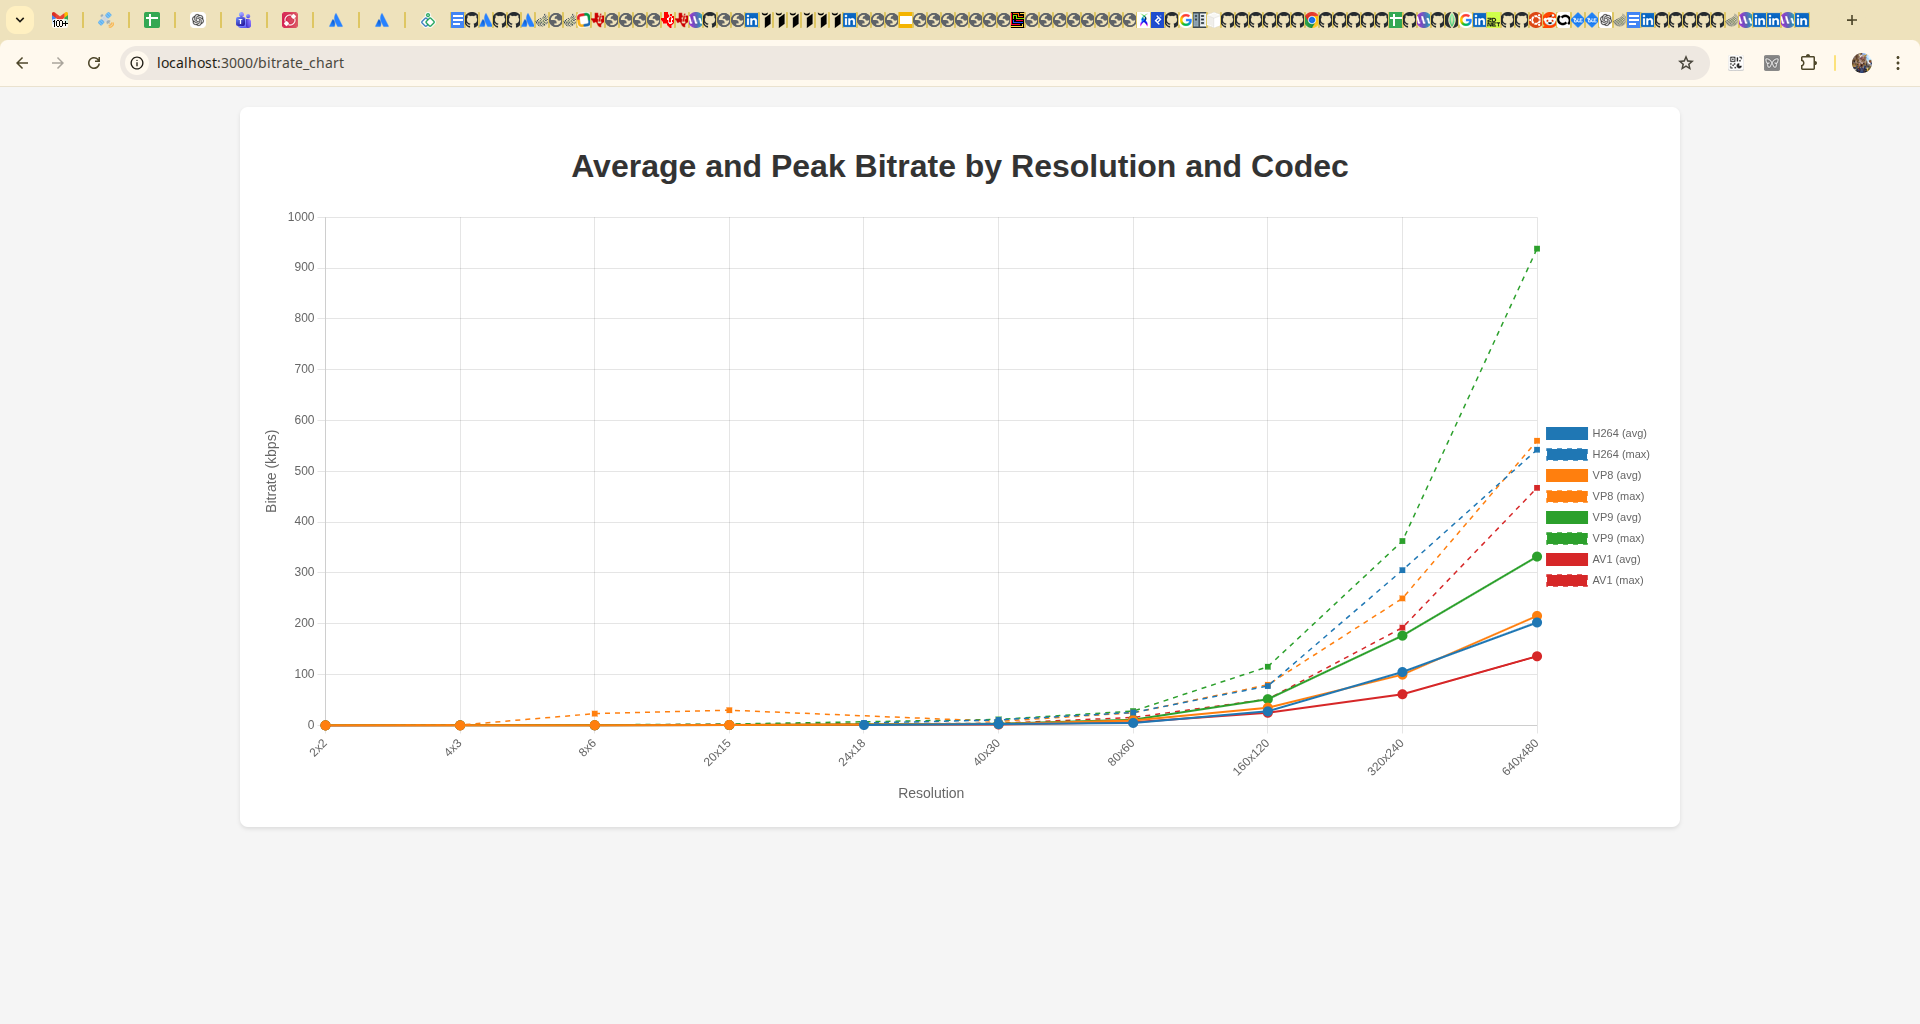
There are three things that immediately stand out from this chart:
- Bitrate does not scale linearly with resolution.
- AV1 is consistently more efficient than other codecs.
- Some codecs (notably VP9) show significantly higher peak bitrate.
Let’s break that down.
What the data actually shows
1. Bitrate scales non-linearly with resolution
From your dataset:
- going from 320×240 → 640×480:
- pixels ×4
- bitrate ~×2–3 (not ×4)
👉 Compression efficiency improves with resolution.
2. AV1 is consistently more efficient
At 640×480:
- H264 ≈ 200 kbps avg
- VP8 ≈ 215 kbps
- VP9 ≈ 330 kbps
- AV1 ≈ 136 kbps
👉 AV1 shows noticeably higher efficiency in this setup (~30–40% less bitrate at VGA).
But…
3. Peak bitrate tells a different story
Example:
- VP9 peak ≈ 938 kbps
- AV1 peak ≈ 467 kbps
👉 Some codecs are more “bursty” than others.
This matters for:
- network buffers
- real-time latency
- congestion control behavior
4. Low resolutions behave weirdly
At tiny resolutions:
- 2×2
- 4×3
- 8×6
Bitrates collapse to almost zero.
But not uniformly:
- VP8 shows strange spikes at very low resolutions
- others stay smoother
👉 This is codec-dependent overhead + quantization effects.
Unexpected result: how little video you actually need
One of the most surprising findings came from extremely low resolutions.
At:
- 2×2 → you can still detect motion
- 4×3 → you start seeing shapes
- 8×6 → objects become identifiable
- ~15×10 → you can recognize faces
Not because the encoder is good, but because the browser is doing heavy interpolation when rendering the video.
This suggests that “minimum usable video” might be far lower than what we usually assume.
5. Packet rate matters (a lot)
We tracked pps, which most people ignore.
This reveals:
- RTP overhead differences
- fragmentation strategies
- encoder packetization decisions
👉 Two codecs with the same bitrate can have completely different packet rates.
And that difference directly impacts:
- CPU usage
- network overhead
- congestion control behavior
The most important insight
After building this, the biggest takeaway is:
WebRTC bitrate is an emergent property, not a parameter
It depends on:
- codec
- resolution
- fps
- content entropy
- packetization
- browser implementation
And most importantly:
you can’t understand it without measuring it
What this changes in practice
Most WebRTC advice online is cargo cult.
People copy bitrate values, codec preferences, and SDP tweaks without ever measuring the result.
This is how myths become best practices.
If you work with WebRTC:
Stop doing this
- “set bitrate = X”
- “VP9 is better than VP8”
- “we need 500 kbps for VGA”
Start doing this
- build controlled experiments
- collect real stats
- compare under identical conditions
Why this matters (real world)
This directly impacts:
- SFU scaling
- mobile data usage
- satellite / constrained links (👀 your case)
- latency vs quality tradeoffs
Final thought
Most WebRTC knowledge is anecdotal.
People copy values, tweak parameters, and assume results. But bitrate is not something you configure. It’s something that emerges from the system.
If you don’t measure it, you don’t understand it. And if you don’t understand it, you’re not controlling it.
You’re just hoping.
Limitations
This experiment was conducted under controlled network conditions. Real-world environments (packet loss, jitter, heterogeneous hardware) may introduce additional behaviors such as increased keyframe frequency and bursty bitrate patterns.
Future Work
Future work includes extending these measurements to:
- lossy networks
- SFU-based topologies
- heterogeneous encoder environments
Reference Implementation
The full implementation used to generate these results is available at Content-PeerConnection-bandwidth
Citing
If you reference this work, please cite the article:
Leganés-Combarro, Jesús (2026).
"WebRTC bitrate is not what you think"
https://piranna.github.io/2026/04/28/WebRTC-bitrate-is-not-what-you-think/
DOI: 10.5281/zenodo.19961278

Reference implementation:
https://github.com/piranna/Content-PeerConnection-bandwidth
Note: Parts of this work were developed with the assistance of AI tools. All experiments, validation and conclusions are my own.